The cftrace tag displays and logs debugging data about the state of your application at the time the cftrace tag executes. You use it to provide "snapshots" of specific information as your application runs.
This section describes the following topics:
The cftrace tag provides the following information:
cftrace tag type attribute
cftrace tag executed
cftrace tag executes.
cftrace tag in the request and the current one. If this is the first cftrace tag processed for the request, the output indicates "1st trace". ColdFusion does not display this information in inline trace output, only the log and in the standard debugging output.
cftrace tag
cftrace call is located
category attribute
text attribute
cftrace call executes, of a single variable specified by the var attribute
A typical cftrace tag might look like the following:
<cftrace category="UDF End" inline = "True" var = "MyStatus"
text = "GetRecords UDF call has completed">
You can display the cftrace tag output in either or both of the following ways:
inline attribute in a cftrace tag, ColdFusion displays the trace output on the page at the cftrace tag location. (An inline cftrace tag does not display any output if it is inside a cfsilent tag block.)
The cftrace tag executes only if you select Enable Debugging on the ColdFusion MX Administrator Debugging Settings page. To display the trace results in the debugging output, you must also specify Tracing Information on the Debugging Settings page; otherwise, the trace information is logged and inline traces are displayed, but no trace information appears in the debugging output.
Note: When you use in-line trace tags, ColdFusion sends the page to the browser after all page processing is completed, but before it displays the debugging output from the debug template. As a result, if an error occurs after a trace tag but before the end of the page, ColdFusion might not display the trace for that tag.
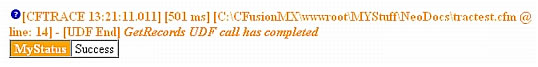
An in-line trace messages look like the following:
The following table lists the displayed information:
| Entry | Meaning |
|---|---|
|
|
Trace type (severity) specified in the |
|
[CFTRACE 13:21:11.011] |
Time when the |
|
[501 ms] |
Time taken for processing the current request to the point of the |
|
[C:\CusionMX\wwwroot\MYStuff\ mydocs\tractest.cfm] |
Path in the web server of the page that contains the |
|
@ line:14 |
The line number of the |
|
[UDF End] |
Value of the |
|
GetRecords UDF call has completed |
The |
|
MyStatus Success |
Name and value of the variable specified by the |
ColdFusion logs all cftrace output to the file logs\cftrace.log in your ColdFusion installation directory.
A log file entry looks like the following:
"Information","web-29","04/01/02","13:21:11","MyApp","[501 ms (1st trace)] [C:\CFusionMX7\wwwroot\MYStuff\mydocs\tractest.cfm @ line: 14] - [UDF End] [MyStatus = Success] GetRecords UDF call has completed "
This entry is in standard ColdFusion log format, with comma-delimited fields inside double-quote characters. The information displayed in the trace output is in the last, message, field.
The following table lists the contents of the trace message and the log entries. For more information on the log file format, see Logging errors with the cflog tag.
| Entry | Meaning |
|---|---|
|
Information |
The Severity specified in the |
|
web-29 |
Server thread that executed the code. |
|
04/01/02 |
Date the trace was logged. |
|
13:21:11 |
Time the trace was logged. |
|
MyApp |
The application name, as specified in a |
|
501 ms (1st trace)] |
The time ColdFusion took to process the current request up to the |
|
[C:\CFusionMX7\wwwroot\MYStuff\mydocs\ |
Path of the page on which the trace tag is located and the line number of the |
|
[UDF End] |
Value of the |
|
[MyStatus = Success] |
Name and value of the variable specified by the |
|
GetRecords UDF call has completed |
The |
