You can create a chart in either of the following ways:
cfchart, cfchartseries, and cfchartdata tags in a ColdFusion page.
To create a chart with ColdFusion tags, you use the cfchart tag along with at least one cfchartseries tag. You can optionally include one or more cfchartdata tags within a cfchartseries tag. The following table describes these tags:
| Tag | Description |
|---|---|
|
Specifies the container in which the chart appears. This container defines the height, width, background color, labels, fonts, and other characteristics of the chart. You must include at least one |
|
|
Specifies a database query that supplies the data to the chart and one or more |
|
|
Optionally specifies an individual data point to the |
The following example shows an outline of the basic code that you use to create a chart:
<cfchart>
   <cfchartseries type="type">
         <cfchartdata item="something" value="number">
   </cfchartseries>
</chart>
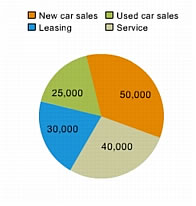
The following example displays a simple pie chart that illustrates four values:
<cfchart>
   <cfchartseries type="pie">
      <cfchartdata item="New car sales" value="50000">
      <cfchartdata item="Used car sales" value="25000">
      <cfchartdata item="Leasing" value="30000">
      <cfchartdata item="Service" value="40000">
   </cfchartseries>
</cfchart>
The following figure shows the resulting chart:
The ColdFusion Report Builder includes a wizard that lets you create charts easily. The wizard lets you specify all of the chart characteristics that you can specify using the cfchart, cfchartseries, and cfchartdata tags. For information about using the Report Builder chart wizard, see Creating Reports for Printing.